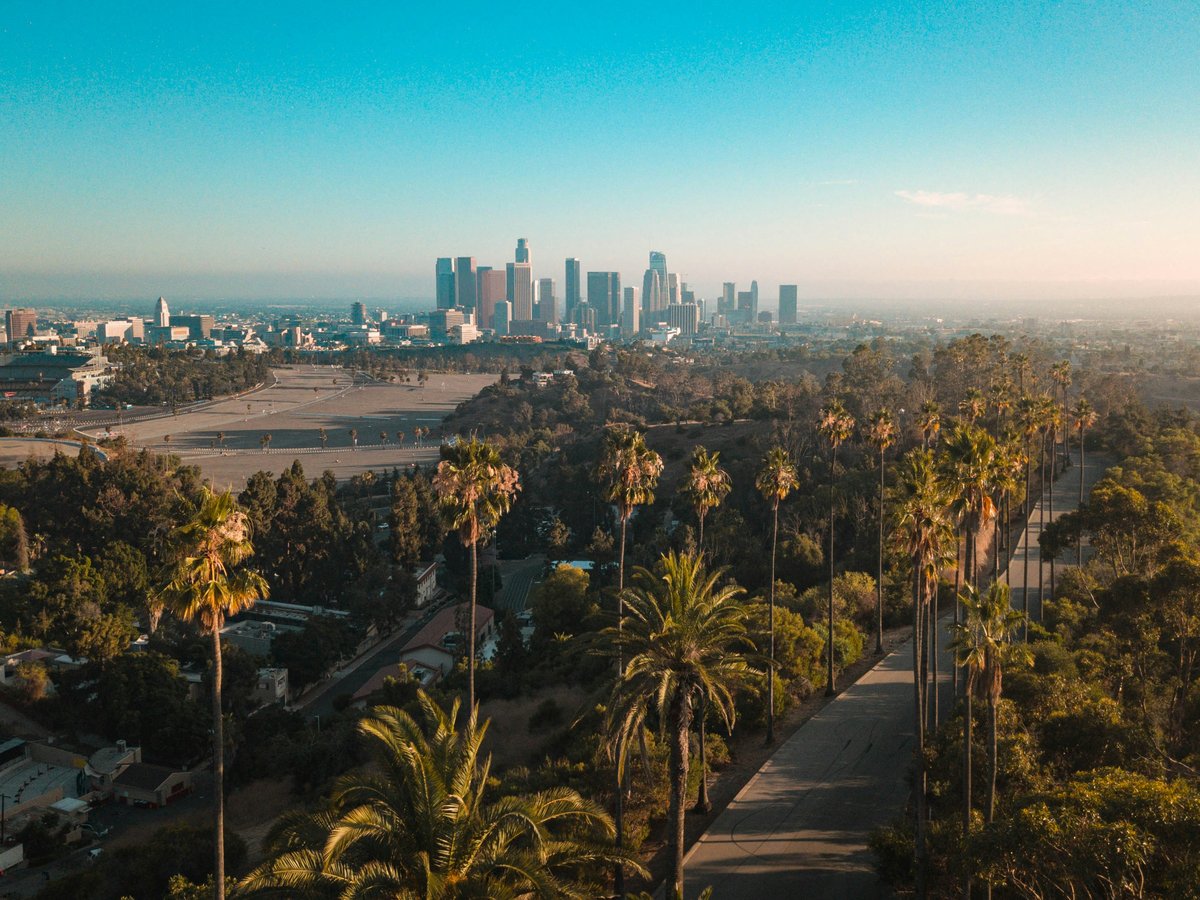
Los Angeles month by month
Plan your visit to Los Angeles by month. Compare weather, crowds, events, and prices across all twelve months with historical climate data.
Los Angeles's measured year splits on one variable, and it is not temperature. From June through September, highs run between 28°C and 32°C with almost no rain. July records 0 rain days at 31°C. August hits 32°C with 1 rain day. December and January drop to 19°C with 5 and 6 rain days, while March logs 8 rain days on a 20°C average. Rain days run from 0 in July to 8 in March.
All 12 month guides are published beneath this index. For a summer trip, open July or August first. August's 32°C average high is the year's warmest, and July sits close at 31°C with 0 rain days. April at 24°C with 2 rain days and October at 27°C with 2 rain days split the difference between summer heat and winter wet. If your dates fall in December or March, read those pages closely. December averages 6 rain days at 19°C, and March carries the year's highest count at 8.
March is Los Angeles's most decisive month, logging 8 rain days against a 20°C average high, more rain than any other month in the measured year.
- January
- High
- 19°C
- Low
- 7°C
- Rain
- 85 mm
January in Los Angeles is the city's rainy season, and that single fact should shape how you plan the trip. Daytime highs sit around 18.6°C (65°F) with lows near 7.4°C (45°F),…
- February
- High
- 20°C
- Low
- 8°C
- Rain
- 110 mm
February is the peak of Los Angeles's brief rainy season, and 110mm of rainfall across roughly 5 wet days makes it the city's second-wettest month after December. That sounds worse…
- March
- High
- 20°C
- Low
- 9°C
- Rain
- 85 mm
March in Los Angeles still belongs to the rainy season. The city averages 85mm of rain across roughly 8 days this month, which matches January but sits well below December's 132mm.…
- April
- High
- 24°C
- Low
- 11°C
- Rain
- 8 mm
April is likely the month Los Angeles was designed to show off. The rainy season that drops 85 to 132mm of water across December through March has dried to a trickle, leaving…
- May
- High
- 25°C
- Low
- 13°C
- Rain
- 7 mm
May in Los Angeles means one thing before all else. The marine layer. Locals have a name for it, 'May Gray,' and it defines the month more than any festival or event. You'll wake…
- June
- High
- 28°C
- Low
- 15°C
- Rain
- 10 mm
June in Los Angeles starts with fog. Locals call it 'June Gloom,' a persistent marine layer off the Pacific that blankets the coast most mornings, sometimes lingering well past…
- July
- High
- 31°C
- Low
- 17°C
- Rain
- 2 mm
July is when Los Angeles finally shakes off the coastal fog that blankets the city through June and delivers the warm, dry summer most visitors expect. Daytime highs reach 31°C…
- August
- High
- 32°C
- Low
- 18°C
- Rain
- 18 mm
August is the hottest month in Los Angeles, and you feel it most a few miles inland from the coast. Daytime temperatures average 32°C (89°F), but the spread between neighborhoods…
- September
- High
- 30°C
- Low
- 18°C
- Rain
- 22 mm
September is the hottest month in Los Angeles. That surprises people who assume August holds the record, but LA's inland valleys routinely hit 38°C (100°F) or higher during…
- October
- High
- 27°C
- Low
- 15°C
- Rain
- 18 mm
October is likely the single best month to be in Los Angeles. The oppressive summer heat has finally broken, daytime highs settle around 27°C (81°F), and the rain that will define…
- November
- High
- 23°C
- Low
- 11°C
- Rain
- 57 mm
November in Los Angeles is defined by one thing above all else. The Santa Ana winds. These hot, dry gusts blow in from the inland deserts, sometimes pushing temperatures past 30°C…
- December
- High
- 19°C
- Low
- 9°C
- Rain
- 132 mm
December falls in the middle of Los Angeles's wet season, though the heaviest months tend to be January and February. You can still expect roughly 61mm of rainfall across about 5…